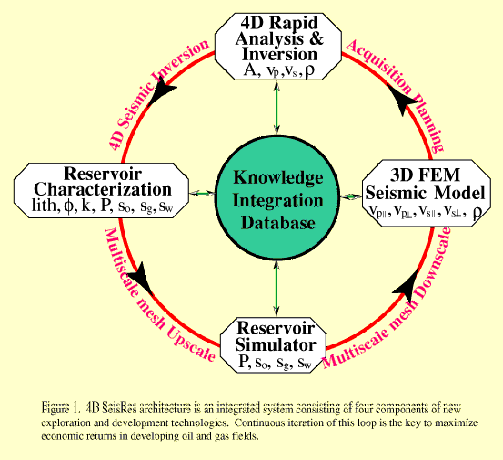
We are developing a 4D seismic reservoir simulation that couples a) the analysis of repeated 3D seismic surveys, b) seismic inversions of each, c) geostatistical reservoir characterizations of each, d) massively parallel reservoir fluid flow simulations, and e) 3D seismic modeling of wave propagation at different time-lapse intervals in an anisotropic, elastic media. This computational environment will connect existing codes that plug-and-play in each of these slots, but deliver an internally consistent answer. Drainage predictions are converted in the seismic simulator into expected acoustic responses, which are then tested against the real-world observations. The loop is constantly iterated so that the system learns the correct fluid flow behavior over time (Figure 1). Better, more efficient drainage performance is the hoped-for result.
The computational efficiencies of the 4D seismic modeling, inversion,
differencing, and reservoir simulation and characterization codes have
made it possible to predict and reproduce 4D seismic and fluid flow changes
observed in oil and gas fields during drainage to the surface. The 4D simulation
environment is keyed to the linkage of five different technologies:
1. Seismic inversion and geostatistical reservoir characterization
link logs (hard data) and 3D seismic observations (soft data) so that a
volumetric prediction of rock physics and fluid parameters at each element
of the volume at each time of observation is possible. Porosity, lithology,
compressional and shear velocity, density, gas, oil and water saturation,
and permeability must be predicted at each element of a several million
element mesh.
2. This static description of the field at fixed snapshots in
time is then fed into a parallel reservoir fluid flow simulator that adds
history matching of the production and pressure changes from wells in the
field to predict specific oil/gas/water drainage behavior over time.
3. The results from the reservoir simulator are then fed into the several million element mesh of a seismic model that predicts the seismic response over time. In order to deal with dispersion and attenuation in stacked pay and acoustically complex reservoirs (most oil fields), the 3D model must be elastic. Probably, five independent elastic constants are required to vary among each volume element over time in order to compute realistic synthetic waveforms.
4. The predictions of the seismic model must be then compared
and differenced with the observed changes in repeated 3D seismic and other
physical properties of the field using a 4D toolkit such as the Lamont
4D Rapid Analysis software.
5. The "man/machine" workflow to support the computing infrastructure must closely parallel the developments and linkages of the other tasks throughout.
The computational development described below has been done in partnership with Western Geophysical, IBM, Landmark and Eclipse. About a year from now, we will be forming a new 4D Seismic Reservoir Monitoring Consortium to provide user-guidance and support throughout the development and implementation of the tools required above.
In order to quantify the predicted bypassed hydrocarbon reserves present in the EI 330 field, we have been working along the seismic reservoir simulation loop in a "sneakerwear" mode, using existing codes from Western, IBM, and us We began with a static description of the rock and fluid physics at the time of the 1992 seismic shoot (Figure 2), and then proceeded to attempt to reconstructed conditions in the field back to the beginning of production in 1972.
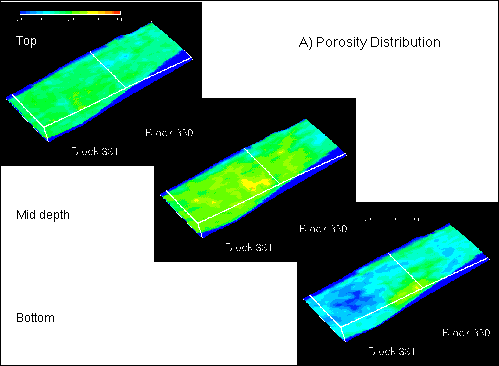
Figure 2. Porosity distribution predicted by a geostatistical co-kriging between logs and the impedance inversion of the 1992 seismic survey for the LF reservoir of the EI 330 field.
4D seismic images of the LF reservoir were iteratively analyzed to compute changes of these petrophysical and fluid parameters. Lithology, porosity, pore fluid pressure, permeability, and gas/oil/water saturation were estimated at each element of the volume over the life of the field. Our method consists of a combination of well log data analysis for lithology determination, spatial cross-correlation computations between lithology and acoustic impedance, and a robust stochastic simulation technique. The conditional stochastic simulation technique we used was a Markov-Bayes method.
The bridge that connected these physical parameters with compressional (and eventually, shear) velocity and density was our 4D seismic inversion. We tested several different inversions, including our Levenburg-Marquart method (Figure 3).
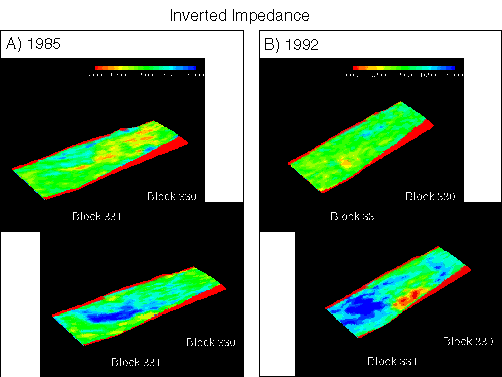
Figure 3. Inversion results for 3D seismic surveys from 1985 (left) and 1992 (right).
We tested several scales of reservoir characterization and simulation
mesh, and found that the fine vertical scale was required to eliminate
the ambiguities introduced by the mesh itself. The characterized reservoirs
are often too smoothly varying due to the lack of lateral resolution. As
3D seismic technology has evolved, the spatial resolution of 3D seismic
data has greatly improved the resolution of reservoir characterization,
particularly in lateral resolution. As the integration of seismic and wireline
logging data has evolved, modern reservoir characterization has become
more and more accurate and reliable. As a result, heterogeneity and discontinuities
in the LF reservoir were revealed that can be seen from the change in impedance
from production that occurred between 1985 and 1992 (Figure 4).
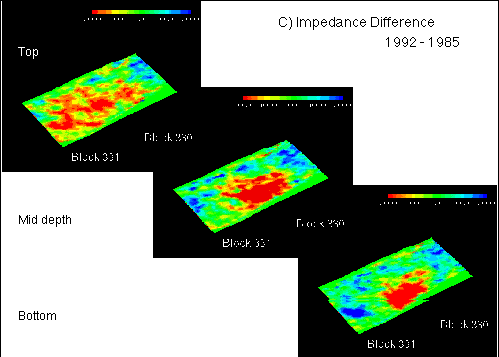
Figure 4. Seismic impedance differences between the two 3d seismic surveys in the EI 330 field.
We the used the reservoir characterization as input to a reservoir fluid flow simulator. We utilized two commercially available reservoir simulators (parallel Eclipse and parallel VIP) for the prediction of time-dependent fluid flow required to history match the previous production and pressure behavior of the field (Figure 5).
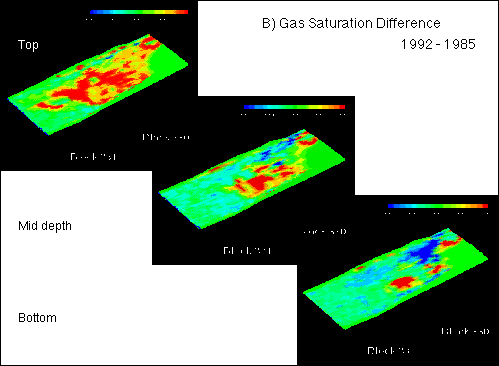
Figure 5. Eclipse reservoir simulation of gas saturations in 1992 in
the LF reservoir of the EI 330 field.
Multi-dimensional seismic forward modeling has gradually become a critical tool in seismic exploration for hydrocarbons. The output of the seismic modeling is a set of volumes with changes in seismic amplitude and travel-time predicted at discrete time-intervals over the life of the field (Figure 6).
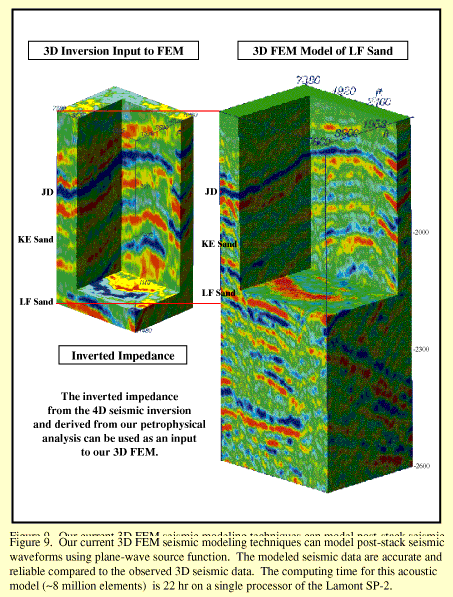
Figure 6. Seismic model from 1992 compared to impedance volume from
the same time.
We then difference them with observed changes from the past using the
Lamont 4D Rapid Analysis software. The similarities and differences between
modeled and real acoustic responses within the reservoirs gives true predictive
verification to the accuracy and precision of the model results (Figure
7).
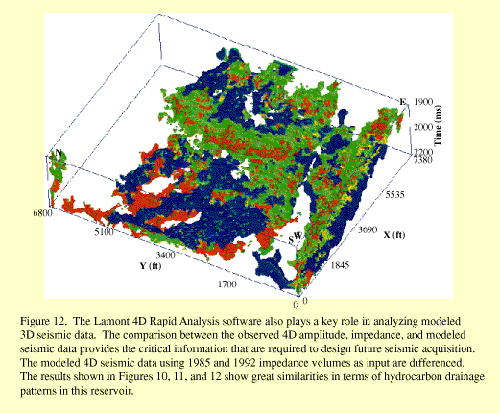
Figure 7. Difference between 3-D seismic model predictions of impedance in 1985 versus 1992 based upon the drainage effects determined from the impedance inversions of the two seismic datasets.
This difference between 1985 and 1992 seismic models (Figure 7) should then be compared with the gas saturtation difference over the same time interval from the reservoir simulator (Figure 5) and the seismic inversion differences (Figure 4). Only when these three representations of drainage in the LF reservoir from 1985 to 1992 have been reconciled can we begin to believe in the accuracy of our 4D predicitons.